When you open a Google PageSpeed report, several layers of information appear at once. You first see Core Web Vitals, then category scores from 0 to 100, and then recommendations in which some of those metrics return again. That can be confusing at first.
Broadly speaking, there are user-centric indicators, which include the Core Web Vitals, and there are broader diagnostic categories such as Performance, Accessibility, Best Practices and SEO. Performance is the most prominent category, and it is strongly influenced by the user-centric metrics. In other words: how fast and stable the site feels to an actual visitor.
Each score also gets a traffic-light colour. Even if you do not know every technical term, it is immediately clear what Google thinks: red is poor, orange means there is room for improvement, and green is good.
User-centric indicators
Core Web Vitals
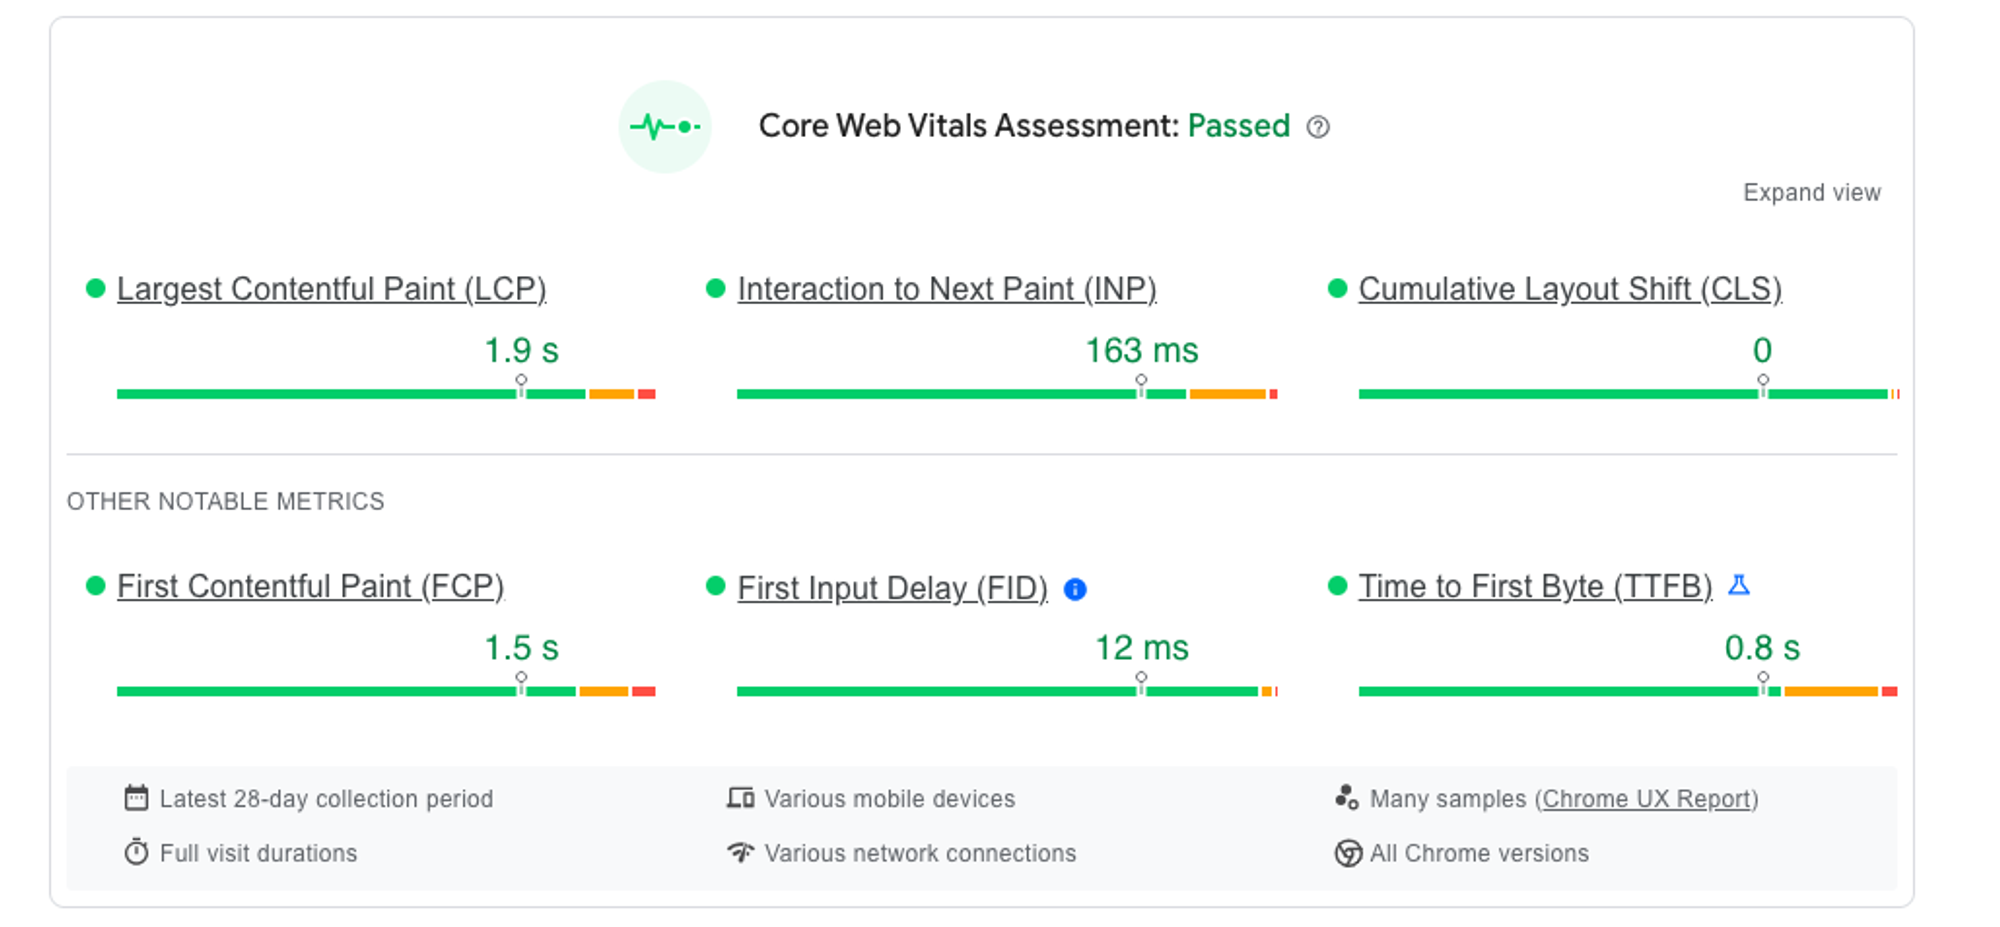
Google uses a number of indicators to judge how a website performs. The best known are the Core Web Vitals. At the time of writing, the most important ones are these three:
LCP (Largest Contentful Paint)
This measures perceived loading speed: how long it takes before the largest visible block of text or image has loaded. A healthy target is below 2.5 seconds.
INP (Interaction to Next Paint)
This measures responsiveness during interaction. In practice, it reflects how quickly a page reacts when a user clicks, taps or types. A strong result is 200ms or less.
CLS (Cumulative Layout Shift)
This measures visual stability. If elements jump around while the page is loading, the CLS score gets worse. A common example is fonts or images loading late and shifting the layout.
Other indicators
In addition to the Core Web Vitals, PageSpeed also shows several supporting performance indicators:
FCP (First Contentful Paint)
This measures how long it takes before the first visible piece of content appears on the page.
TBT (Total Blocking Time)
This measures how much time the browser is blocked and unable to respond well to user input after the first content has appeared.
TTFB (Time to First Byte)
This indicates how quickly the server starts responding. It says a lot about hosting quality, caching and backend performance.
What should you focus on?
Do not treat the report as a game in which the only goal is to reach 100. Use it as a diagnostic tool. The most important question is not whether the score is perfect, but whether the report reveals friction that real users actually feel.
A meaningful interpretation of PageSpeed scores always combines the numbers with context: the type of website, the audience, the devices they use and the business goals the page needs to support.


